You remember your best trades.
Your ledger remembers all of them.
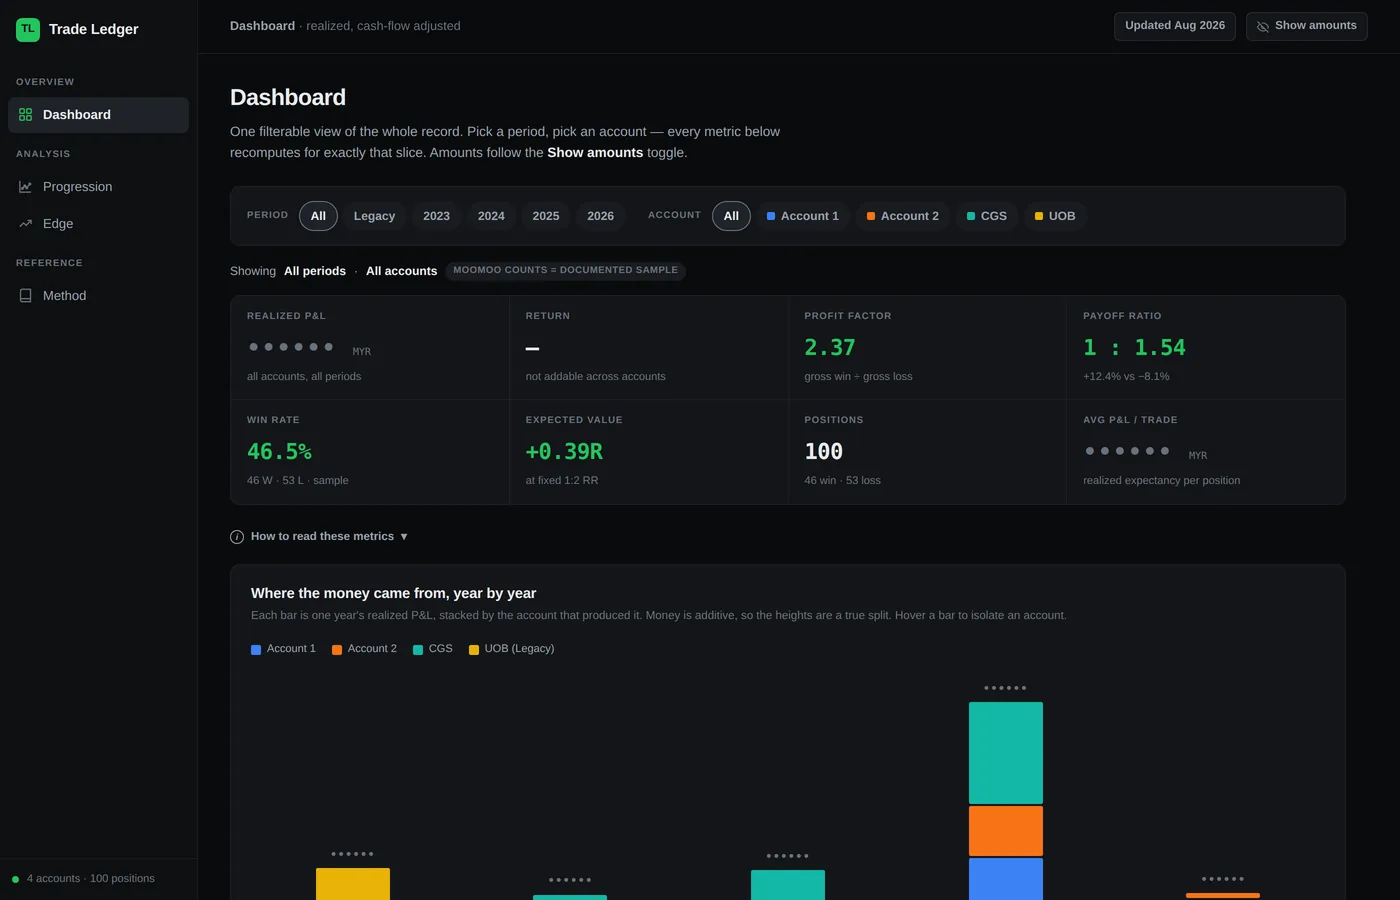
Every trader knows their P&L. Almost none know their edge. I ran the numbers on my own trading — about a hundred closed positions across four accounts — and found that three trades were 93.7% of the profit in the whole ledger. I had no idea.
This is the prompt I used to find that out. It's free, it works with any broker, and it will tell you things about your trading you'd rather not know.
No signup. Nothing to install. Works on statements, exports, or screenshots.
I built this because my own numbers were wrong
Not the arithmetic — the story I was telling myself with them. I knew I'd had a good year. I was wrong about why, which is the only part you can repeat on purpose.
Three things came out of it. None were what I expected.
of the ledger's net profit came from three trades. Out of roughly a hundred. Everything else, added together, was noise around zero.
win rate on trades I held under a week. Seven attempts, seven losses. Not unlucky — structurally negative, over and over, while I kept doing it.
my average loss, shrinking across four accounts. My win rate over the same period fell from 46% to 27%. I never got better at picking. I got better at losing.
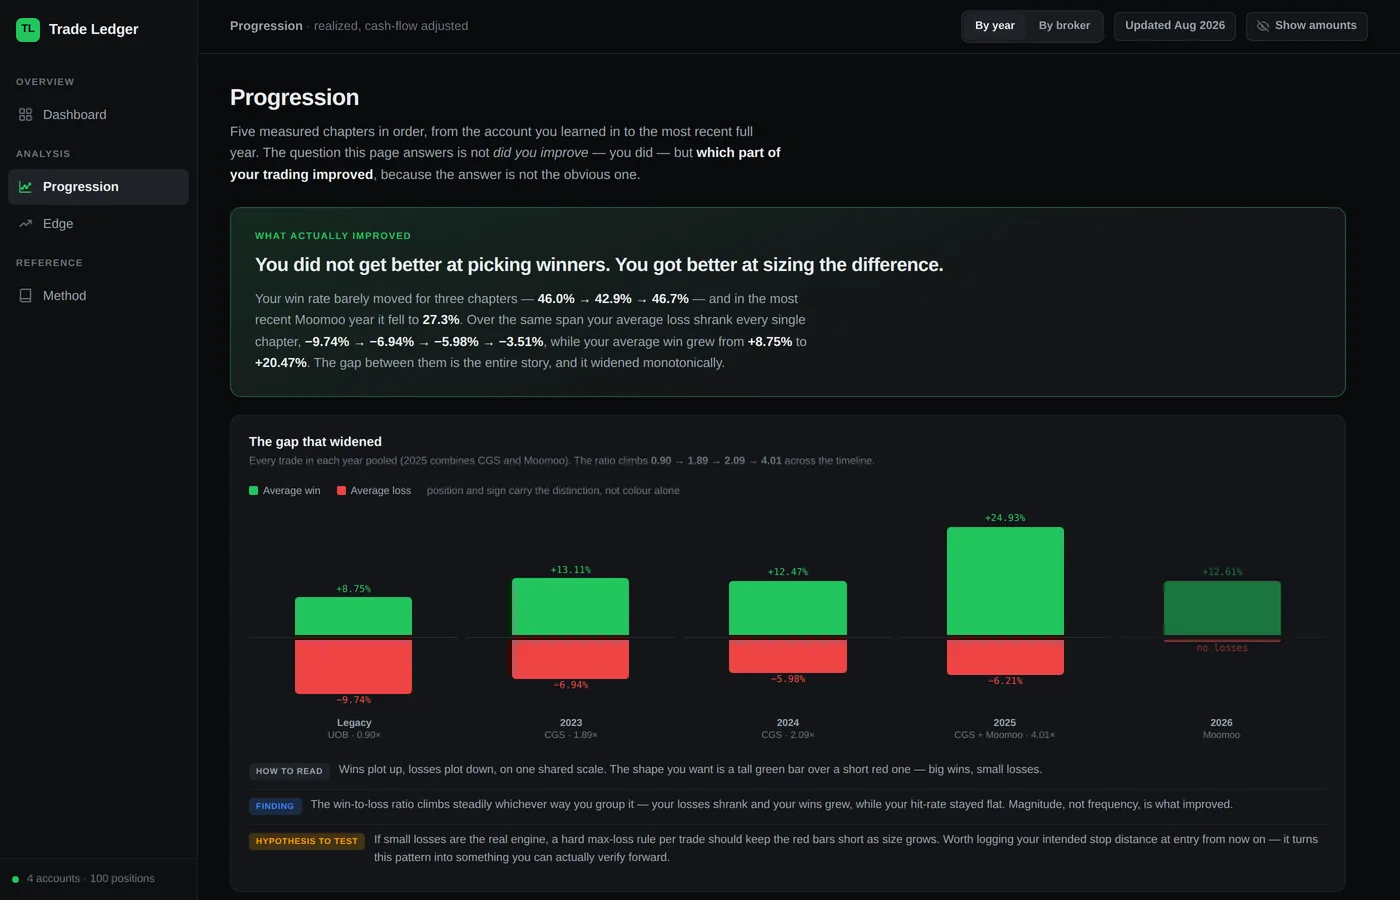
I wouldn't have found any of that by remembering. Memory keeps a highlight reel with the losses edited down. The ledger doesn't.
How it works
Four steps, and the only one that takes any effort is gathering your files. You don't need to tidy them, name them, or fill in a spreadsheet first — attach what you already have.
-
Put your statements in one place
Everything you have — statements, contract notes, exports, screenshots. Don't sort them and don't clean them up.
In CoworkDrop every file into one folder and connect that folder to your session.
In chatUpload every file into a single conversation before you send anything.
-
Copy the prompt
It's on this page, below. One button.
-
Paste it and send
It starts by telling you what it received and what's missing. Answer its questions — it will ask before it guesses.
-
Get your dashboard
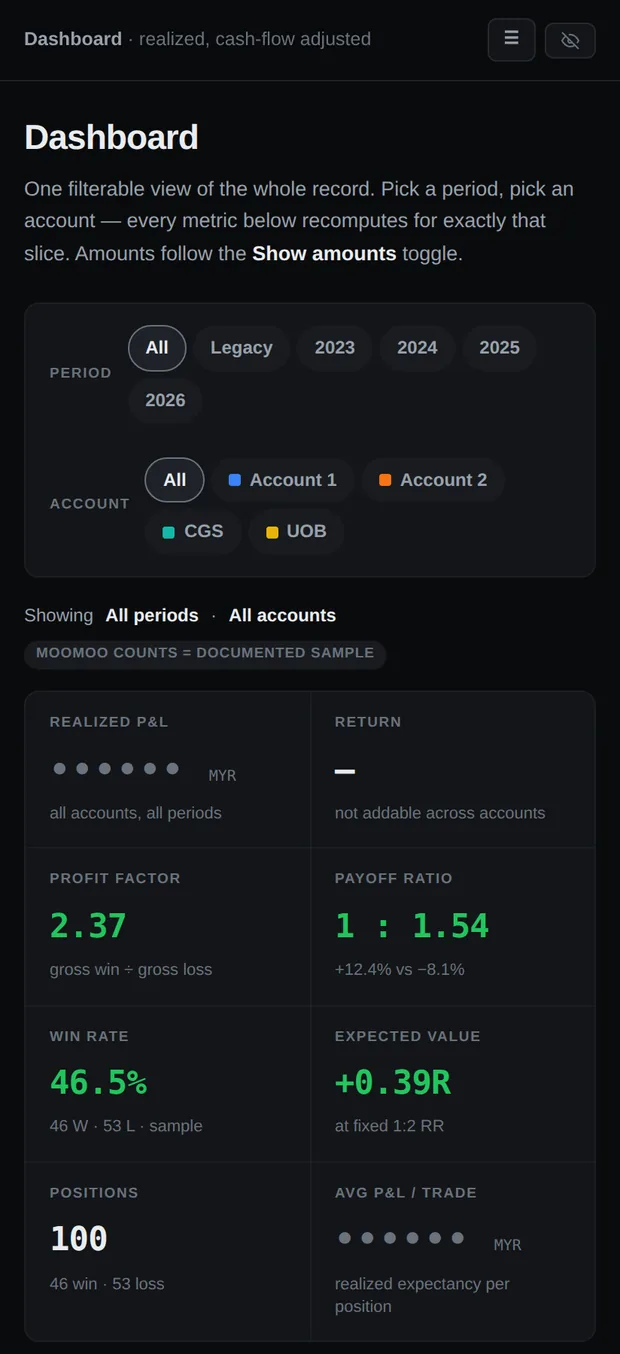
A single HTML file you can keep, open offline and re-read. Plus a plain-language readout: what your record proves, what it only hints at, and the one habit costing you the most.
You can, and it will happily calculate them. The part that matters here is the validation step — before it computes anything, the prompt checks whether your numbers mean what you think they mean. Four of mine didn't. That's sections further down this page, and it's the whole reason this exists.
Here it is
Copy this, paste it into Claude, attach your statements. That's the whole thing.
You are going to build me an honest Trade Ledger from my own trading records.

I care more about being told the truth than about looking good. If my sample
is too small to prove something, say so. If a number I believe is wrong,
correct it. Do not soften findings to be encouraging.

===========================================================
PHASE 1 — EXTRACT
===========================================================

Read every file I attach. They may be monthly statements, contract notes,
realized-P&L exports, CSV files, or screenshots of a trade history screen.
They may come from different brokers, in different formats, in different
currencies, and they may overlap or conflict.

Build one normalised table of CLOSED positions with these columns:

  account | symbol | market | instrument | side | open_date | close_date
  qty | multiplier | entry_price | exit_price | fees | currency
  return_pct | hold_days | confidence

Rules for extraction:
- Only CLOSED round-trips. Open positions are not results yet — list them
  separately as "still open" and exclude them from every statistic.
- Match buy quantity against sell quantity. If they do not reconcile, say so
  rather than guessing.
- If a position was scaled in or out over several fills, aggregate it into one
  position using weighted-average entry and exit prices, and note how many
  tranches it took.
- Tag every row with its INSTRUMENT: cash equity, warrant, or futures.
  Tag SIDE as long or short.
- For a SHORT, return is (entry - exit) / entry. Getting this backwards silently
  inverts every short in the record.
- For a futures contract, record the CONTRACT MULTIPLIER / point value - e.g. a palm-oil contract of 25 tonnes, a crude
  contract of 1,000 barrels. If a multiplier is not stated in my documents,
  ASK ME. Do not guess it, and do not assume 1.
- Set confidence for every row:
    HIGH   = dates and prices both read directly from a document
    MEDIUM = one field inferred (e.g. date inferred from price against a chart)
    LOW    = mostly reconstructed
  Show the confidence mix in your summary. Never present a LOW-confidence row
  with the same authority as a HIGH one.
- NEVER invent a trade, a date, a price or a fee. If something is unreadable,
  list it under "could not read" and move on.

===========================================================
PHASE 2 — VALIDATE  (do not skip this — it is the whole point)
===========================================================

Before computing anything, run these five checks and report the result of each
in plain language. Most people's numbers are wrong for one of these reasons.

1. THE DENOMINATOR CHECK
   If any document shows a headline "return %" or "yield", work out what it is
   divided by. Brokers variously divide P&L by turnover, by average balance, by
   deployed capital, or by starting equity — these give wildly different answers
   from the same money. Never repeat a broker's headline % without stating its
   denominator. If you cannot determine the denominator, say the figure is
   unusable and compute your own.

2. THE TRUNCATION CHECK
   Many broker "realized P&L" screens show only the most recent N rows, not
   your lifetime history. Test for it: realized profit can never decrease over
   time, so if I give you two snapshots of the same screen from different dates
   and the total FELL, the screen is a rolling window and my true lifetime P&L
   is unknown and larger. Also flag it if the row count is suspiciously round
   (exactly 50, exactly 100).

3. THE CASH-FLOW CHECK
   A return derived from account VALUE must exclude deposits and withdrawals,
   or a withdrawal reads as a loss and a top-up reads as a gain. Use:
       monthly return = (end value - start value - net deposits) / start value
   then chain the months geometrically. Realized P&L on closed trades needs no
   such adjustment. If I have not given you dated cash flows, say that any
   account-level % is unreliable and tell me exactly what to dig up.

4. THE BASE CHECK
   A percentage return means nothing without knowing the capital it ran on.
   +300% on a small account and +30% on a large one are not comparable, and the
   small one usually made less money. Always report percentage return and
   money contribution side by side, and say plainly which account actually
   moved the pile.

5. THE SAMPLE CHECK
   Count my closed trades. Then tell me honestly what that count can support:
       under 20   - anecdotes; describe direction only, no statistics
       20 to 50   - suggestive; every figure needs a caveat
       50 to 100  - meaningful, still sensitive to outliers
       over 100   - reasonably solid
   Also check whether any single trade dominates. If removing my best trade
   flips me from profitable to unprofitable, that is the single most important
   fact about my record and it must appear at the top of the dashboard.

6. THE LEVERAGE CHECK  (skip if I traded nothing but fully-paid shares)
   Leveraged and unleveraged instruments cannot share a statistic. A 2% move on
   a futures contract at 10x is +20% on the margin you posted and +2% on the
   notional you controlled — and neither is comparable to +2% on a share you
   paid for in full. Blending them produces a number that describes nothing.

   So:
   - Report futures as a SEPARATE BOOK from cash equities. Never merge them
     into one win rate, one profit factor, or one average return.
   - A MARGIN account has the same problem in a quieter form: "capital" is
     ambiguous there, because the money I committed and the buying power I used
     are different numbers. If any account is margin, say which denominator
     you used for its return and why.
   - For leveraged positions, state return TWO ways and label both: return on
     margin posted, and return on notional controlled. If margin isn't in my
     documents, say so and give notional only.
   - Money IS additive across instruments. Percentages are not. Combine the
     books in currency terms only, never as a blended percentage.
   - ROLLOVERS: consecutive positions in the same underlying across contract
     months are usually ONE economic trade, not two. Flag any pair that looks
     like a roll, ask me, and if confirmed merge them — otherwise my trade
     count inflates and my true holding period collapses.
   - Some futures statements report daily mark-to-market / variation margin
     rather than per-trade P&L. If mine do, say so plainly: per-trade
     statistics may not be recoverable from that format, and a daily equity
     curve is the honest thing to build instead.

===========================================================
PHASE 3 — COMPUTE
===========================================================

State every formula you use. Show all of these:

  Core
  - Number of closed positions; date range covered
  - Win rate (wins / total)
  - Average win %, average loss %
  - Payoff ratio (avg win / avg loss)
  - Profit factor (gross profit / gross loss) - the single best summary
  - Expectancy per trade, in money and in R
  - Largest win, largest loss, median trade

  The uncomfortable ones - these are the point of the exercise
  - CONCENTRATION: what share of net profit came from my top 3 trades?
  - What happens to every metric if my single best trade is removed?
  - Maximum drawdown, and the longest losing streak
  - My losing months, shown as prominently as my winning ones

  The cut that usually explains everything
  - Performance grouped by HOLDING PERIOD:
      same day / 1-7d / 8-30d / 31-90d / 91-180d / 180d+
    For each bucket: count, win rate, average return, share of net P&L.
    In most retail records this single cut separates winners from losers more
    cleanly than symbol, sector or position size. Check whether it does for me.
  - Performance by position size, and whether my biggest positions were also
    my best ideas or just my most confident ones
  - Performance by market or instrument type, if I traded more than one -
    reported as separate books per the leverage check, never blended
  - If I traded both an underlying and a leveraged instrument on it (a warrant
    or a future), compare them directly - same view, same period, different
    vehicle. That comparison is usually the most instructive single thing in a
    mixed record.

===========================================================
PHASE 4 — BUILD
===========================================================

Produce a single self-contained HTML file. No external files, no CDN links,
no libraries — inline all CSS and JS, draw charts as inline SVG. It must open
correctly from a local file and be readable in both light and dark themes.

MOBILE IS NOT OPTIONAL — I will read this on my phone. Specifically:
  - Start the file with <!DOCTYPE html> and a real <head>, and put
    <meta name="viewport" content="width=device-width, initial-scale=1">
    in it. Without that tag a phone renders the page at ~980px wide and every
    responsive rule you write is dead. This is the single most common way a
    generated dashboard ends up unreadable on a phone.
  - Nothing may scroll the page sideways at 390px wide. Wide tables and wide
    charts scroll inside their own container, never the body.
  - Any KPI grid reflows to two columns on a phone, and any fixed sidebar
    either collapses behind a menu button or becomes a top bar. If a sidebar
    slides off-screen, give it a real width first — translating an element of
    zero width moves it nowhere and its contents spill over the page.
  - Tap targets at least 44px. Charts sized in relative units, never fixed px.
  - Tell me you have checked these before you hand the file over.

Structure:
  - A KPI row: profit factor, win rate, payoff ratio, expectancy, trade count
  - Filters for period and account that recompute every metric live
  - An equity curve and a monthly-return bar chart WITH the red months visible
  - The holding-period breakdown
  - A full sortable table of every position, with its confidence flag
  - A METHOD section stating every formula, every assumption, every gap in
    the data, and the results of the five Phase-2 checks

  - A ZEN MODE toggle that hides all money amounts behind dots, leaving only
    percentages. Default it to ON, so I can screenshot the dashboard and share
    it without publishing my account size.

Design rules:
  - Put drawdown, the losing streak and the concentration finding ABOVE the
    fold, not buried. Publishing the unflattering numbers is the entire point.
  - Never use colour alone to carry meaning - label things.
  - No hype language anywhere. No "crushing it", no rocket emojis.

===========================================================
PHASE 5 — TELL ME THE TRUTH
===========================================================

Finish with a plain-language readout, written for me, not for an audience:

  1. What my record actually proves, and what it only hints at.
  2. The one habit costing me the most money, with the evidence for it.
  3. The one thing I am doing right that I should do more of.
  4. What I would need to log from now on to answer the questions this data
     cannot answer. Be specific about the fields.

Rules for this section:
  - No encouragement that the data does not support.
  - If my record is not yet profitable, say so directly, and say what the data
    suggests is causing it.
  - If my sample is too thin for conclusions, lead with that rather than
    burying it.
  - Do not tell me what to buy or sell, and do not forecast my future returns.
    This is an analysis of what already happened.

Begin with Phase 1. Before you start, list what you received and tell me what
is missing that would materially improve the analysis.
It runs in five phases: extract your trades, validate them, compute the metrics, build the dashboard, then tell you the truth in plain language. It's instructed not to flatter you, not to invent data it can't read, and not to tell you what to buy.
Two CSVs, free, no email needed: trades template and cash-flow template. Fill them in by hand if your broker exports badly, or not at all.
Any broker. Any country. Whatever you've got.
There's no integration and no account to connect. You attach files. It reads them.
Works best with
- Monthly statements
- Contract notes
- A realized P&L export
- A CSV of your trade history
Also works with
- Screenshots of your trade history
- Futures and warrants
- A mix of brokers and currencies
- Documents that overlap or contradict
- A half-filled spreadsheet
Give it what you have. It will list what it received, tell you what's missing that would materially improve the analysis, and label every row it had to reconstruct — so you know which numbers to trust.
It handles them — with one condition. A leveraged position has two different returns: on the margin you posted, and on the notional you controlled. They can differ by ten times, and neither is comparable to a share you paid for in full. The prompt keeps your leveraged book separate from your cash book and reports both returns rather than blending them into a number that describes nothing. It also flags contract rollovers, which otherwise double your trade count and halve your holding period. If your statement doesn't state the contract multiplier, it will ask rather than guess.
Screenshot your broker's realized-P&L screen. Then do it again in a few weeks and compare the totals. If the number went down, your broker has been showing you a rolling window, not your history. Mine was — see trap 2.
Four ways your numbers lie before you even interpret them
Every one of these came out of my own record. I'd been quoting all four of them for years.
A broker app showed +4.84%. The real figure was over 100%.
Official, in the app, on the screen — sitting right underneath a perfectly correct profit figure.
Divide the profit by the percentage and you can reverse out what it was measuring: the summed cost of every position I had ever bought in that account. Not the money I put in — the money I put in, counted again every time I recycled it into the next trade. Over a couple of years of rotating the same capital, that denominator grows to many times the actual account.
It goes the other way just as often. Some platforms flatter you by dividing gains by your average balance, or by whatever happened to be deployed at the time. And on a margin account the word "capital" is ambiguous before you even start — the money you committed and the buying power you traded with are two different numbers, and a broker can quote a percentage against either.
The habit: any percentage you didn't calculate yourself, work out what's underneath the line. Often you can reverse it out in one division, as above. If you can't, it's decoration.
Realized profit went down between two screenshots
Realized profit cannot go down. Closed trades stay closed. The screen only ever showed the last fifty rows — as new trades came in, old ones dropped off the bottom, and one of them had been a decent winner. It was never a lifetime total. I'd been quoting it as though it were my whole history.
The habit: screenshot it twice, weeks apart, compare. And be suspicious of any list that stops at exactly 50 or exactly 100 rows.
One of my months read +0.02%. It wasn't a bug.
Compare your balance at the start and end of the month and every withdrawal reads as a loss, every top-up as a gain. The fix is arithmetic, not judgement:
monthly return = (end − start − net deposits) ÷ start, chained across months.
That flat month looked broken. It wasn't — a withdrawal was being correctly excluded, and underneath it almost nothing had moved.
The habit: keep your cash flows with dates. It's the most commonly missing input in this whole exercise.
The best-looking account earned the least money
One account in the ledger returned over 300% in a year. It produced less than a quarter of that year's actual profit, because the base was tiny. A calmer account returned far less and contributed more than half.
Both percentages were true. Only one of them paid for anything.
The habit: always read percentage return and money contribution side by side. Percentage measures skill on the capital you had. Money measures what it did to the pile.
The cut that explained more than everything else combined
I re-sorted my record by how long I held, expecting nothing much. It separated my winners from my losers more cleanly than the stock, the sector, the market, the year, or how much I'd risked.
| Held | Win rate | Share of net profit | |
|---|---|---|---|
| 14 days or less | 36% | -4.6% | |
| 15 - 60 days | 36% | -6.4% | |
| 61 - 180 days | 83% | +14.7% | |
| Over 180 days | 100% | +93.7% | |
Bars run left of centre for negative contribution, right for positive. Sign and position carry the distinction, not colour.
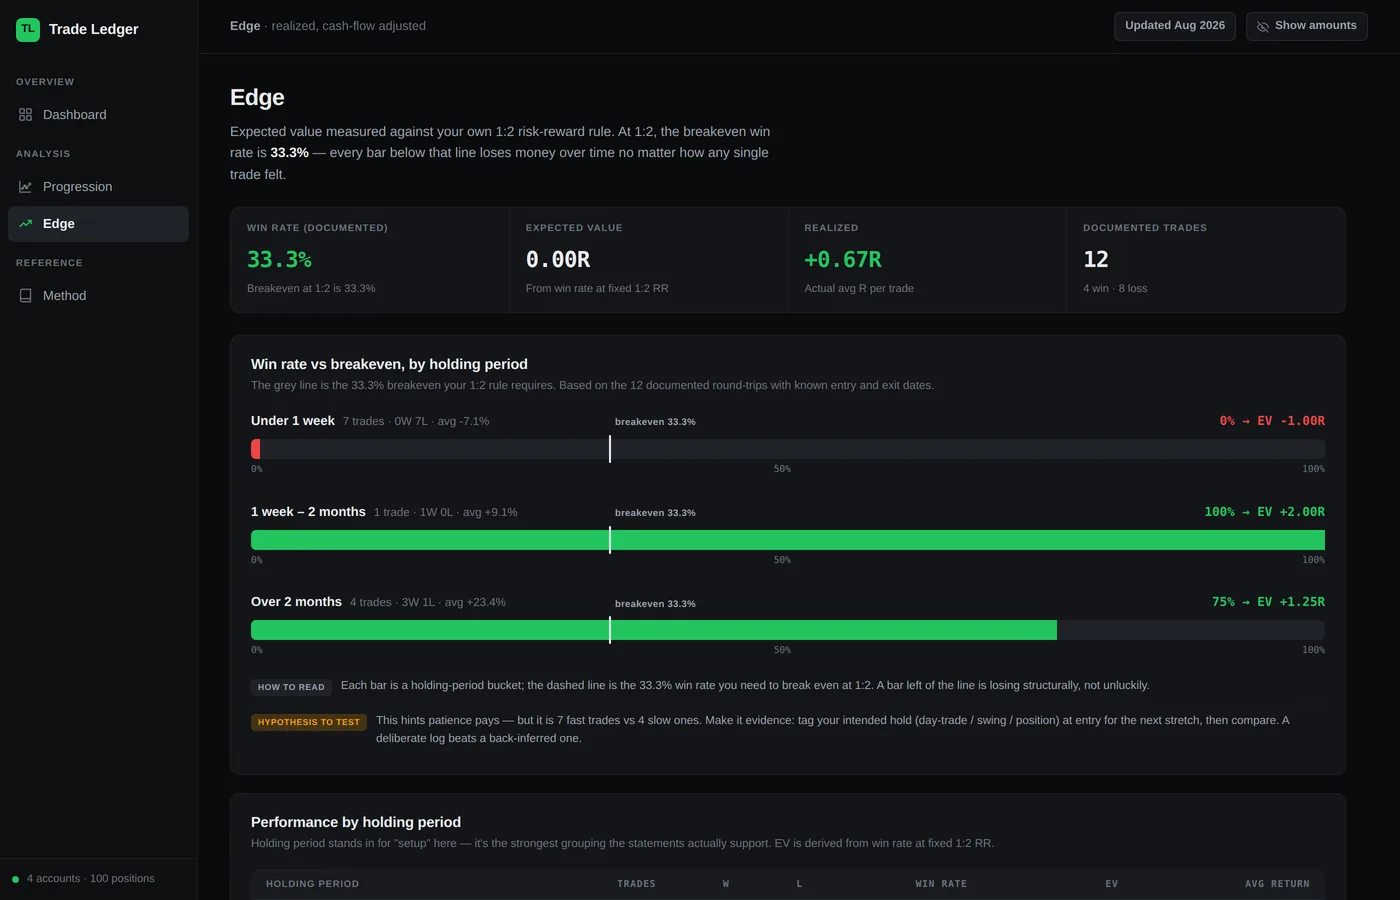
Inside that first row sits the detail I still find hard to look at: in two of the accounts, the seven trades I held under a week went 0 for 7.
And one more. I traded the same company two ways in the same period — the ordinary shares, held 224 days, returned +35%. The warrant on that company, held 7 days, lost 12%. Same company. Same read on the business. Same person. The instrument and the holding period destroyed the trade.
Six trades held past six months, six winners. That's a real pattern and a thin sample in the same breath. A hundred trades sounds like a track record; three trades carrying the result is a fat tail, and a fat tail is not a proven edge. I'm holding both of those at once, and your dashboard will make you do the same.
Your table will look different from mine. That's the point — go find out which bucket actually pays you, and then ask how much of your activity is sitting in the ones that don't.
Four fields, logged at entry, that I wish I'd had
Your statements can tell you what happened. They can't tell you what you meant to happen — and that gap is where most of the useful analysis dies. Everything above was reconstructed after the fact, which is why so much of it carries a caveat.
- Your intended stop, in price, at the moment you enter.Without it you can't measure risk, so you can't express anything in R, so you can't compare a big trade to a small one honestly.
- Your intended hold — day trade, swing, or position.Then you find out whether your losers failed, or whether you just never meant to be in them that long.
- The setup, in two or three words, from a fixed list you write down once.This is what eventually lets you say this pattern pays me and this one doesn't.
- Why you exited — target, stop, changed my mind, needed the money, couldn't sleep.This is the one that tells you the truth about your psychology, and the one everybody skips.
The templates have columns for all four. Fill them at entry, not afterwards. A deliberate log beats a reconstructed one, and I'm living with the difference.
All four fields have columns waiting in the trades template.
What this won't do
Your dashboard describes what already happened. It doesn't predict what happens next, and a good-looking record isn't a promise.
It won't tell you what to buy or sell. It won't forecast your returns. It won't tell you you're doing well if the data doesn't say so — I wrote it to be blunt on purpose, because a tool that flatters you is worse than no tool.
And my own numbers, honestly: three trades carried nearly all of the profit, several of these accounts rest on samples too thin to prove anything, and the most impressive-looking percentage ran on a base so small it barely mattered. I'm reasonably confident I've found something real about how I should trade. I'm not confident it's an edge that survives contact with more money, and I'm trying not to pretend otherwise.
That's about the level of confidence I'd hold about your dashboard too, in either direction. If it looks bad, it's probably a small sample and a fixable habit. If it looks great, delete your best trade and look again.
I'm doing this in the open
I write about building a rules-based process — what I try, what works, what blows up, what I learn. Frameworks and post-mortems, not signals. No tips, no calls, no returns to brag about.
huzai4.substack.com — unsubscribe whenever.
An expected-value calculator — work out whether your win rate and your risk-reward actually add up to an edge, and what your risk of ruin looks like at your position size.